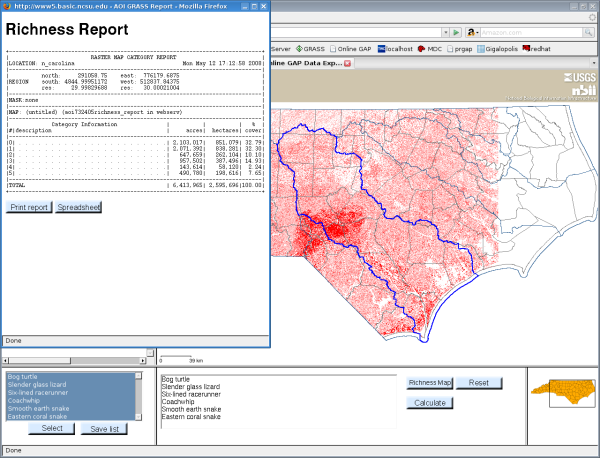
Select multiple species mode on the select species tab. Select desired species from the selected species, either singly or using the ctrl key to select multiply, and select and they will appear in the adjoining frame. Select richness map to draw the map, or calculate to get a report. The map will draw with a value of white for zero species occuring, red for the maximum, and a range between. Generating a report can be useful for interpreting the map, since it shows the maximum or red value.